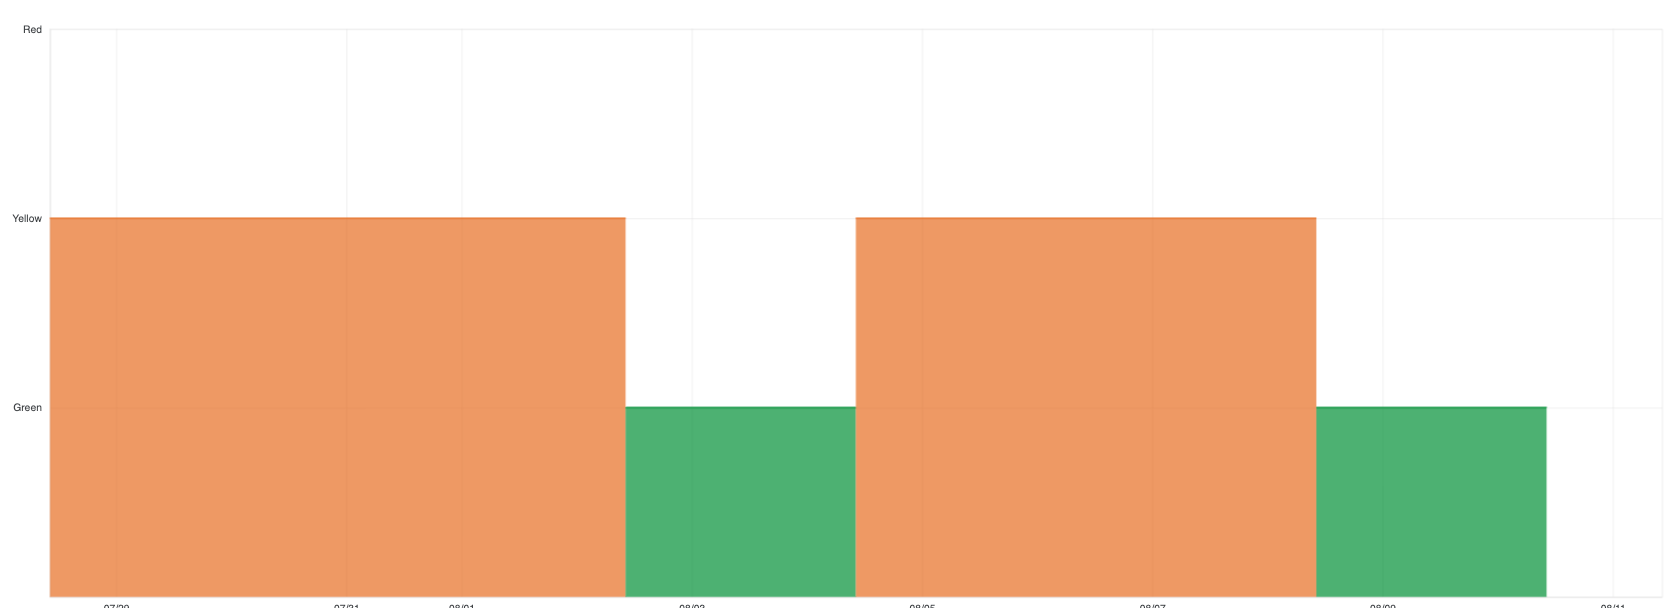
❓ Why does an AWS Elasticsearch cluster get a yellow status?
This post will provide a comprehensive look at all the common cluster issues. Read on for a detailed analysis.
⏳ Let's dive deep into the underlying architectural and query perspectives.
ℹ️ Suppose the overall configuration of our AWS Elasticsearch cluster is –
- Total data nodes - 3. Per node configuration —
- Instance type: r6g.xlarge.search [32 GiB RAM]
- Volume type: EBS
- Volume size: 1150
- Total master nodes - 2
- Total shards - 168
- Field data cache size - 18
- Max clause count - 2000
- Total indices - 15 where two indices are the big ones named 'mehadi_v0.49' & 'test-v1.0'.
- Shard configuration for each index: 5 primary shards & 1 replicas. So, 'mehadi_v0.49' has 5 primary shards & 5 replica shards. Same for 'test-v1.0' index.
🧠 Let's examine whether this cluster configuration aligns with best practices.
📌 First, we need to understand the common recommendations which are –
- Use VPC domain of cluster deployment.
- Use fine-grained access control.
- Enable encryptions.
- Choose the right instance types.
- Use dedicated master nodes for ensuring cluster stability.
- If budget is not problem then use Instance Store (local NVMs).
- 10-50GiB for shard size for search-heavy indices & 30-50GiB shard size for write-heavy indices.
- Keep the number of documents on each shard below 200 million.
- Use warm or cold data storage tiers.
- Use aliases for the main indices.
- To enhance fault-tolerance, use multiple AZs & proper sharding.
- For time-series data, use Index Lifecycle Management (ILM).
- Enable slow logs.
- And as a general rule of thumb, we should have fewer than 3000 indices per GB of heap on master nodes.
If we don't follow best practices, the cluster can become unstable. This instability can cause the cluster status to change from green to yellow or even red. This happens when one or more replica shards are in an unassigned state.
ℹ️ Every data node sends its heartbeat to master nodes. When the master node misses a few heartbeats, it assumes the node has failed, marks it as dead, and immediately unassigns all shards that were on it (both primary and replica). Shard allocation is a very high-priority task for the master node. It immediately starts re-assigning the shards back to the newly available node. And whenthe JVM memory pressure gets very high that means the GC gets paused for a long time which stops the node to send heartbeat to the master nodes.
When does one or more shard get unassigned?
Ans: 1) Overloaded Nodes (High CPU Spikes; High JVM Memory pressure) 2) Disk Space Watermark 3) Frequent Deployments or Restarts.
Threfore, commonly this might occur when the JVM memory pressure is above 75% or even 92%. If it consistently goes above 95% for a while, the cluster will trigger the circuit breaker to prevent it from crashing due to an out-of-memory issue.
💡 The potential root causes include:
- Oversized shard
- Uneven shard allocation (hot node problem)
- Large field data caching
- Heavy aggregations
- Inefficient queries
- Over max clause count settings
- Low EBS PIOPS
And the affected metrics are:
- ClusterWriteIndexingBlocked
- Request Rejections (SearchThreadPoolRejected & IndexingThreadPoolRejected)
- Too Many Requests (429)
- High CPU Utilization
- Frequent/full GCs
- Cache Evictions(Loss of cached results and fielddata)
- High Search Latency
- High Indexing Latency
- Long running queries
- Yellow Cluster Status
Hence, we have 3 data nodes to get an even shard allocation –
At first, for mehadi_v0.49 (582 GiB) index:
- Calculation: 582 GiB/40 GiB per shard ≈ 14.5
- Recommendation: Create a new index with 15 primary shards [5 shards in each data node]
and for test-v1.0 (374 GiB) index:
- Calculation: 374 GiB/40 GiB per shard ≈ 9.35 ≈ 12
- Recommendation: Create a new index with 12 primary shards. [4 shards in each data node]
💡 To resolve these issues, a practical and cost-effective approach is to temporarily scale the existing cluster and use the _reindex API. This method is a more efficient alternative to a blue/green deployment.
Blue/Green Deployment: This involves setting up an entirely new, parallel cluster (the 'green' environment), reindexing data to it from the current cluster (the 'blue' environment), and then cutting over traffic. Although it ensures zero downtime, it is more costly. In contrast, using the reindexing API is a more cost-effective method that also provides near-zero downtime.
⚒️ 🔥 To perform reindexing with temporary scaling, follow these key steps: 🔥
- Scale out the cluster by adding one or more data nodes.
- Create the new indices, ensuring they are configured correctly. For example:
PUT /mehadi_v0.50
{
    "settings": {
         "index": {
           "number_of_shards": 15,
           "number_of_replicas": 1
         }
       },
       "mappings": {
        // Copy mappings from mehadi_v0.49
      }
}
PUT /test-v1.1
{
    "settings": {
         "index": {
           "number_of_shards": 12,
           "number_of_replicas": 1
         }
       },
       "mappings": {
        // Copy mappings from test-v1.0
      }
}
POST /_reindex
{
    "source": {
        "index": "my-old-index"
},
    "dest": {
        "index": "my-new-index"
    }
}
- Atomically switch to the new index using an alias.
POST /_aliases
 {
  actions": [
    { "remove": { "index": "mehadi_v0.49", "alias": "my-data" } },
    { "add": { "index": "mehadi_v0.50", "alias": "my-data" } }
  ]
}
POST /_aliases
 {
  actions": [
    { "remove": { "index": "test-v1.0", "alias": "my-test-data" } },
    { "add": { "index": "test-v1.1", "alias": "my-test-data" } }
  ]
}
- Verify and delete the old indices.
- Finally scale down the cluster to the previous state.
🔖 Summary:
If the issues discussed above are encountered, we should first verify that the cluster's configuration—including data volume, instances, and queries—adheres to recommended best practices. If all best practices are being followed, the next step is to scale the cluster either up or out.
Happy learning! 📚