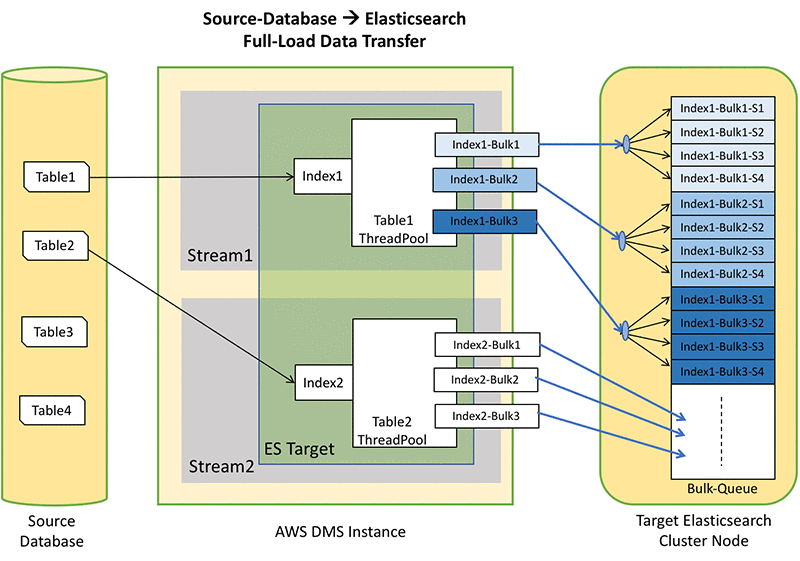
Demystifying Elasticsearch Threadpool & Queue 🧠
⏳ When a data node receives a request—such as a search query—it attempts to process the request by allocating an available thread from the corresponding thread pool. If all threads in the pool are currently in use, the request is enqueued in the associated wait queue, where it remains until a thread becomes available for processing.
For example: Search thread pool size: 20 Search queue size: 1,000
This configuration allows up to 20 concurrent search operations, with an additional 1,000 requests permitted to wait during periods of high load.
Now, two requests come in the ES cluster — routed to the above configured data node. The available queue size remains 1,000 (no requests queued yet). Two search threads are assigned to process the requests. Available search threads drop to 18.
📌 Note that thread pools and queues reside on data nodes. Each data node has the same thread pool types (e.g., search, index, bulk, get) with default or manually configured sizes and queue capacities. These settings are defined cluster-wide. Anyway, actual available capacity varies per node based on current utilization.
🧠 Why do we need thread pools and queues? — due to efficient resource management and handling of concurrent operations.
Now, let's examine thread pool and queue size configuration. The size allocation settings can be fixed or scaling (dynamic) Dynamic thread pools are typically used for background tasks like snapshot/restore, warmer, refresh, merge, flush, and management. Whereas the fixed-size thread pools are used for request-processing tasks such as search, indexing, and get.
ℹ️ A fixed queue size implies a bounded queue; otherwise, the queue is unbounded.
thread_pool:
        search:
            size: 30
            queue_size: 10000
thread_pool:
        write:
            size: 30
            queue_size: 1000
ℹ️ Write threads pool manages incoming index, delete, update, and bulk requests. Whereas, Index thread pool only manage the indexing requests. There is another bulk thread pool. Anyway, in the modern Elasticsearch/OpenSearch service supports all the operations are handled by a single unified write thread pool.
🧠 What happens if incoming requests find the node's associated queue is full? Ans: The new requests will be rejected. This is known as thread pool rejection — such as ThreadpoolSearchRejected, ThreadpoolWriteRejected. Then the client typically receives a 429 HTTP status code.
🔴 ThreadPoolRejection issues can occur due to several factors, including:
- Insufficient hardware resources: CPU, memory, I/O.
- Misconfigured thread pool sizes: inappropriate sizes and queues.
- High request rates: maybe cluster is receiving really a high number of requests, and
Slow request processing: slow queries, inefficient index structures, or insufficient hardware resources might be the reasons.
💡 To troubleshoot these issues, we can use ES's
APIs:
- built-in monitoring API,
- _settings API,
- _nodes/stats,
- _cat/shards,
- _cat/thread_pool,
- _cat/nodes,
- slow logs
Therefore, when you see rejected requests or high CPU usage related to specific operations (like search or indexing), it indicates that the thread pools and queues on the data nodes handling those operations are under pressure.